In March, we showed that global article output is accelerating, with 7.23M DOI-indexed articles in 2025 alone, and the highest year-over-year growth rate in decades.
In May, Silverchair released its second annual 2026 Future of Peer Review Report, which looked at submissions through its ScholarOne manuscript submission platform, and reported 33% growth in the first quarter of 2026 compared with the matching quarter of 2025.
Here, we look at submissions to ICLR, the International Conference on Learning Representations, a major machine learning conference. ICLR echoes the accelerating growth rates we and others have reported. Submissions grew from 490 to more than 60,000 in ten years (counts are from the OpenReview API; see Methods).
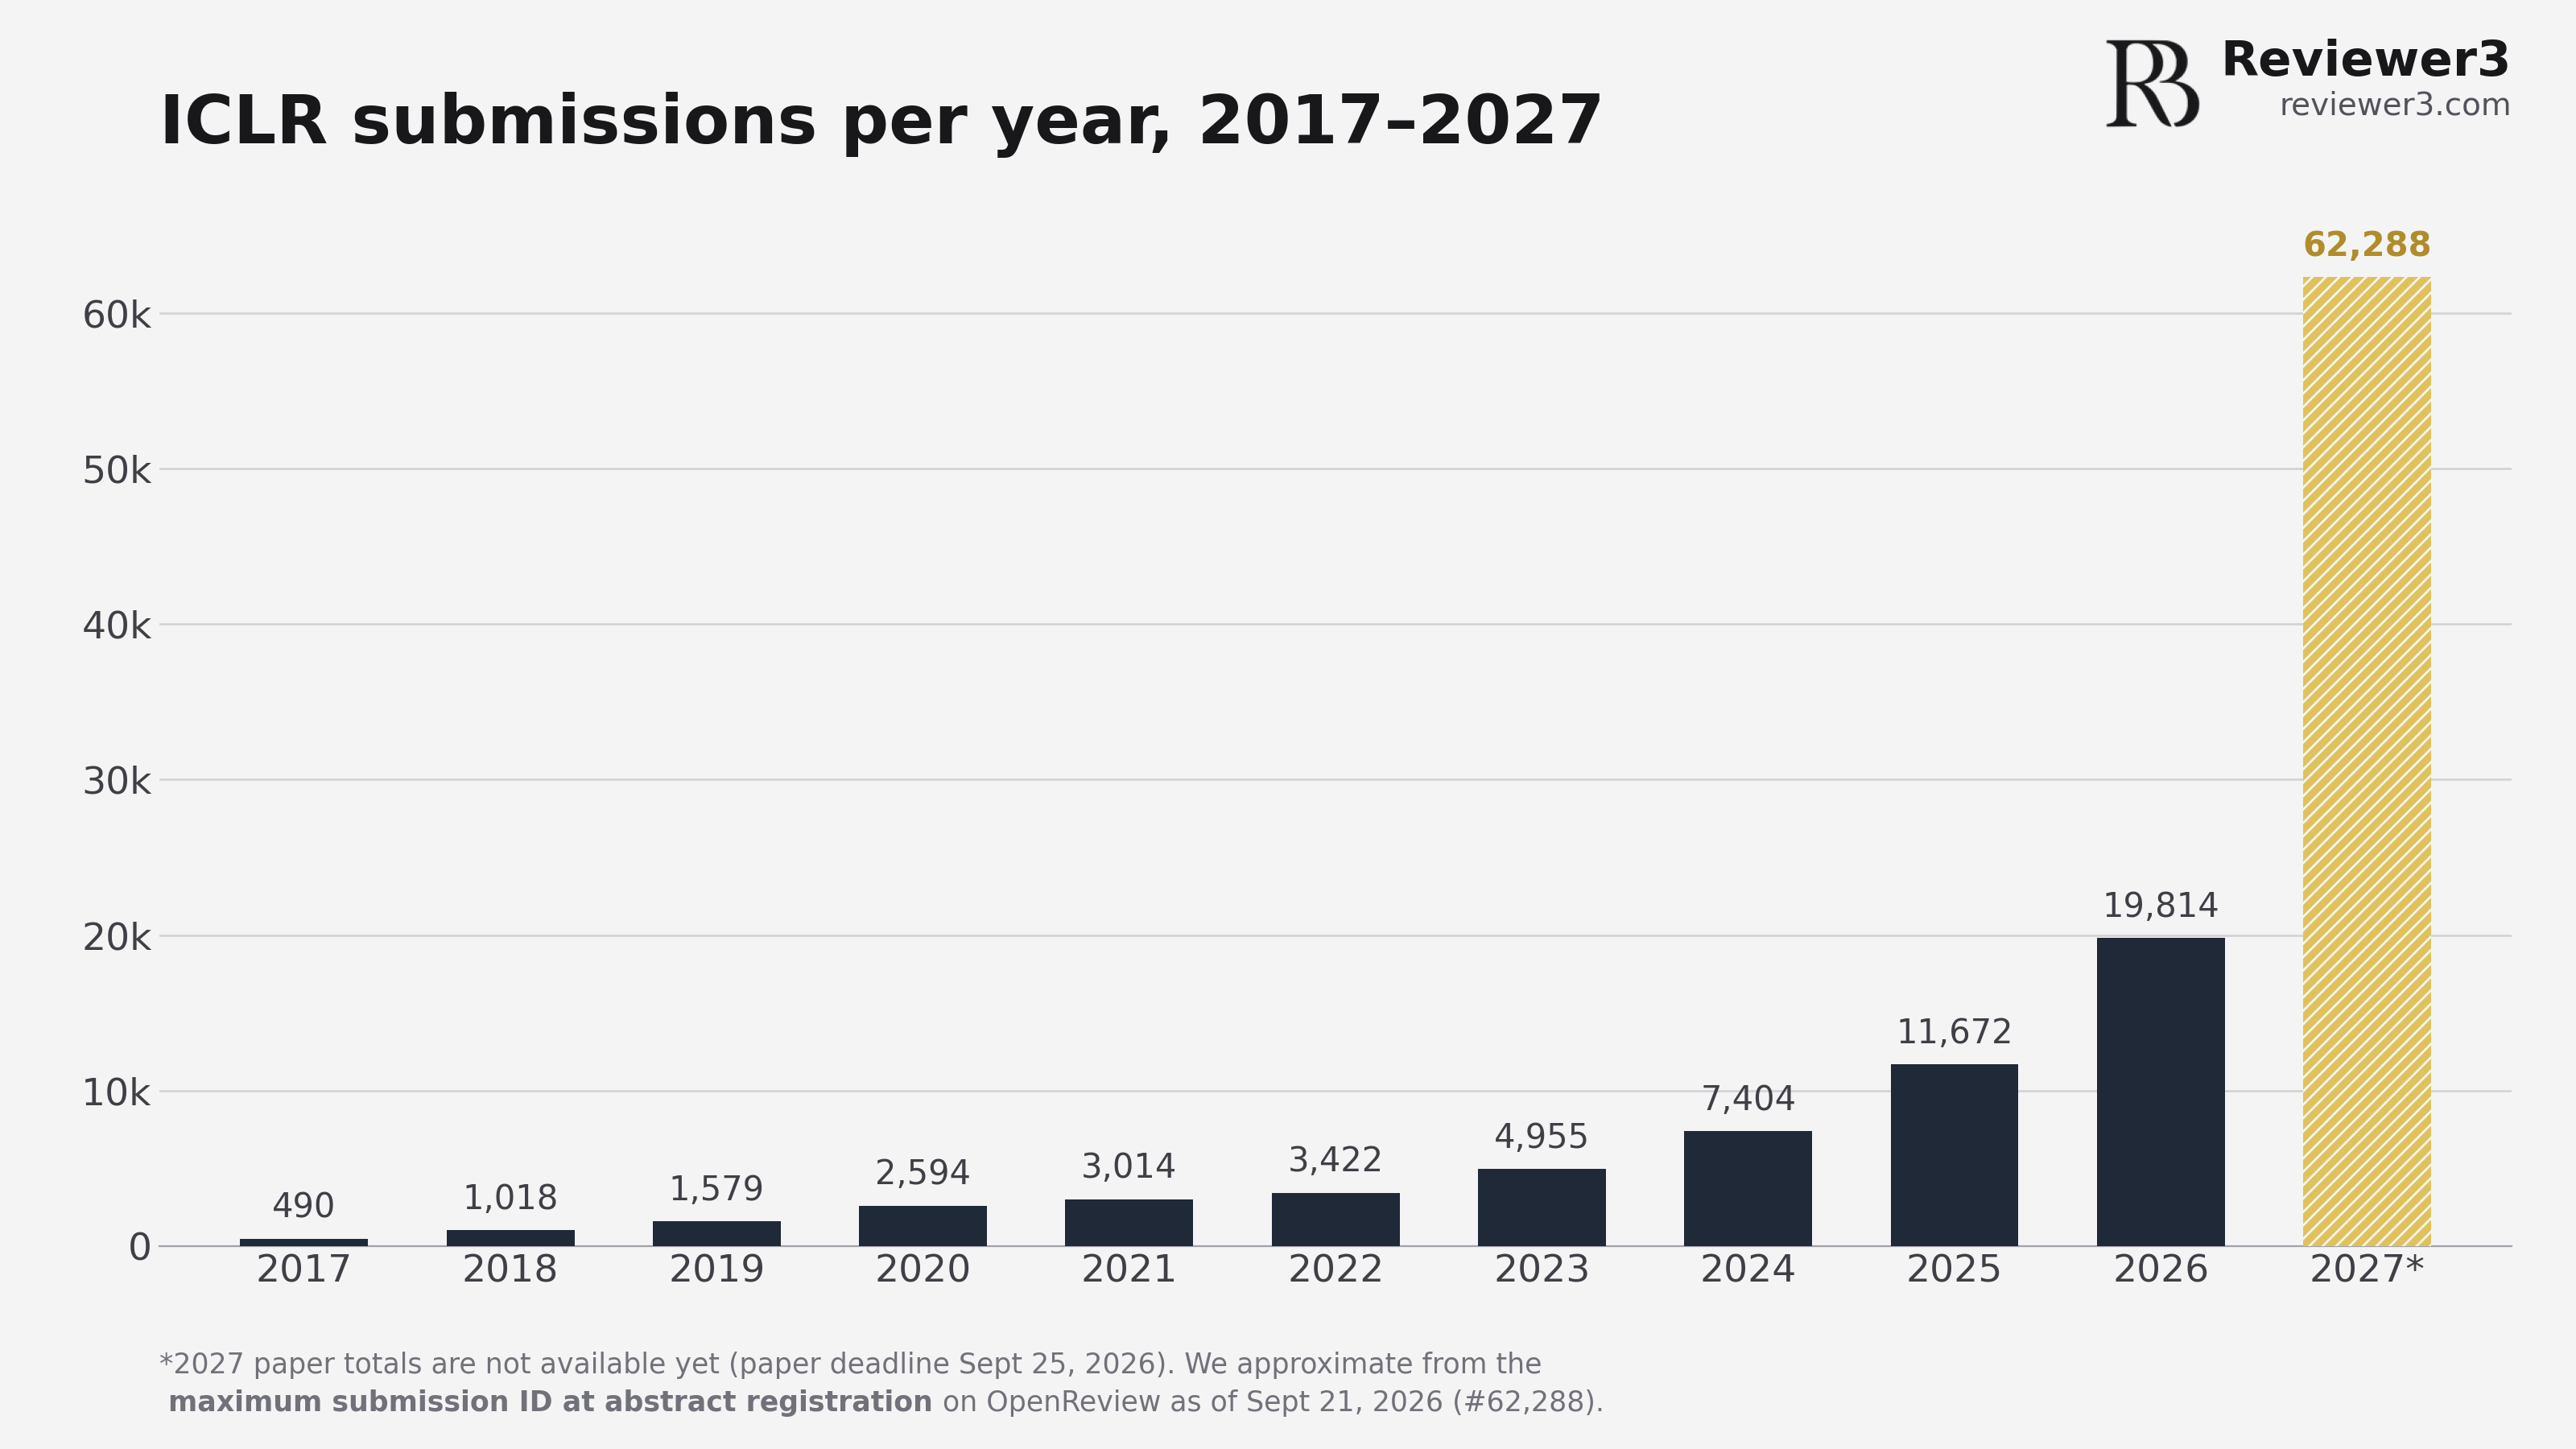
Figure 1. Submissions to the ICLR main conference by year. 2017–2026 are papers; 2027 paper totals are not available yet, so the bar reflects registered abstracts approximated from the maximum submission ID on OpenReview.
Reviewer capacity and the 2027 quota
As shown in Figure 1, ICLR submissions rose 49% in 2024, 58% in 2025, and 70% in 2026. Though 2027 paper totals are not available yet, 62,288 abstracts have been registered, up 143% from the number of abstracts registered for ICLR 2026 (25,649).
The reviewer pool cannot sustain this growth. In 2025, ICLR had 18,325 reviewers for 11,603 submissions, with each reviewer averaging 2.6 papers and each area chair a stack of around 14 (ICLR 2025 Fact Sheet). At the 2025 ratio, 62,000 submissions would need roughly 98,000 reviewers.
ICLR's solution to this asymmetry between submission volume and the finite reviewer pool has been to implement quotas. On September 2, 2026, ICLR published new submission policies for 2027 stating that no author may appear on more than 20 submissions.
Growth beyond machine learning
The rest of the literature is also on an exponential curve, though not yet as extreme as what is being seen in machine learning. We show a 6.4% exponential fit in OpenAlex data over the last 25 years and 11.9% YoY growth in 2025 alone. As AI adoption grows, so will volume. Researchers that use AI methods already publish 3.02× more papers, and new tools make it possible to go from prompt to paper in seconds.
More research is good, provided that it is legitimate and scientifically sound. Rather than implement quotas, we are building tools to tell good and bad research apart.
Reviewer3 decomposes papers into claims and evidence and checks all of it, surfacing unsupported claims, invalid references, and code that does not replicate. These checks can run on every submission before a human reads it, surfacing critical issues to support human judgment.
Related: see ReviewBench for a comparison of human and AI reviews on 1,000 ICLR 2025 papers.
Methods
We gathered submission counts from the OpenReview API on September 21, 2026. For 2017 through 2023, we summed the count returned by the legacy OpenReview API for each of three invitations: Blind_Submission, Withdrawn_Submission, and Desk_Rejected_Submission (2017 has a single submission invitation and no withdrawn or desk-rejected track). For 2024 through 2026, the current API returns no counts and every paper lives under a single Submission invitation, so we paginated through all of them and summed the accepted, rejected, withdrawn, and desk-rejected papers by venueid. For 2027, ICLR paper totals are not available yet, so we used the maximum submission ID number assigned on OpenReview as of September 21, 2026 to approximate. Note that IDs will not necessarily reflect valid paper totals. For comparison, ICLR 2026 assigned IDs up to 25,649 but reported 19,525 valid submissions. The ICLR Fact Sheets (2021, 2022, 2023, 2024, 2025, 2026) match our 2021 count exactly, but report slightly fewer submissions from 2022 on (e.g. 3,391 in 2022 compared with our 3,422). ICLR does not publish what it counts as valid in its Fact Sheets but has previously described these as "valid, format-compliant."
Table 1. ICLR submissions per year, with the OpenReview counts that make up each total.
| Year | Total | Reviewed | Withdrawn | Desk-rejected |
|---|---|---|---|---|
| 2017 | 490 | 490 | 0 | 0 |
| 2018 | 1,018 | 935 | 83 | 0 |
| 2019 | 1,579 | 1,419 | 160 | 0 |
| 2020 | 2,594 | 2,213 | 369 | 12 |
| 2021 | 3,014 | 2,594 | 403 | 17 |
| 2022 | 3,422 | 2,617 | 779 | 26 |
| 2023 | 4,955 | 3,792 | 1,145 | 18 |
| 2024 | 7,404 | 5,690 | 1,661 | 53 |
| 2025 | 11,672 | 8,611 | 2,991 | 70 |
| 2026 | 19,814 | 13,703 | 5,203 | 908 |
| 2027* | 62,288 | N/A | N/A | N/A |
- 2027 is approximated using the maximum submission ID assigned at abstract registration as of September 21, 2026, as paper totals are not yet available.