A thin-film optics paper that plots a calculated spectrum makes a claim anyone can check. The physics is textbook: given the layers, their thicknesses, each material's optical constants and the angle of the light, the transfer-matrix method gives one answer. If a paper states its inputs, its figure should follow from them.
So we checked. Reviewer3 read open-access thin-film papers into structured records, and multilayer.app, a free thin-film optics calculator, recomputed each paper's figure and compared it with the paper's own curve. For 177 papers it worked end to end, and 1 in 4 of them didn't reproduce: for 43 papers, every recomputed figure scored poor against the paper's own curve. Among the 104 reproductions built only from the paper's own inputs, the share is the same: 27 scored poor. All 181 reproductions are public, and each opens in a live calculator with the paper's stack loaded.
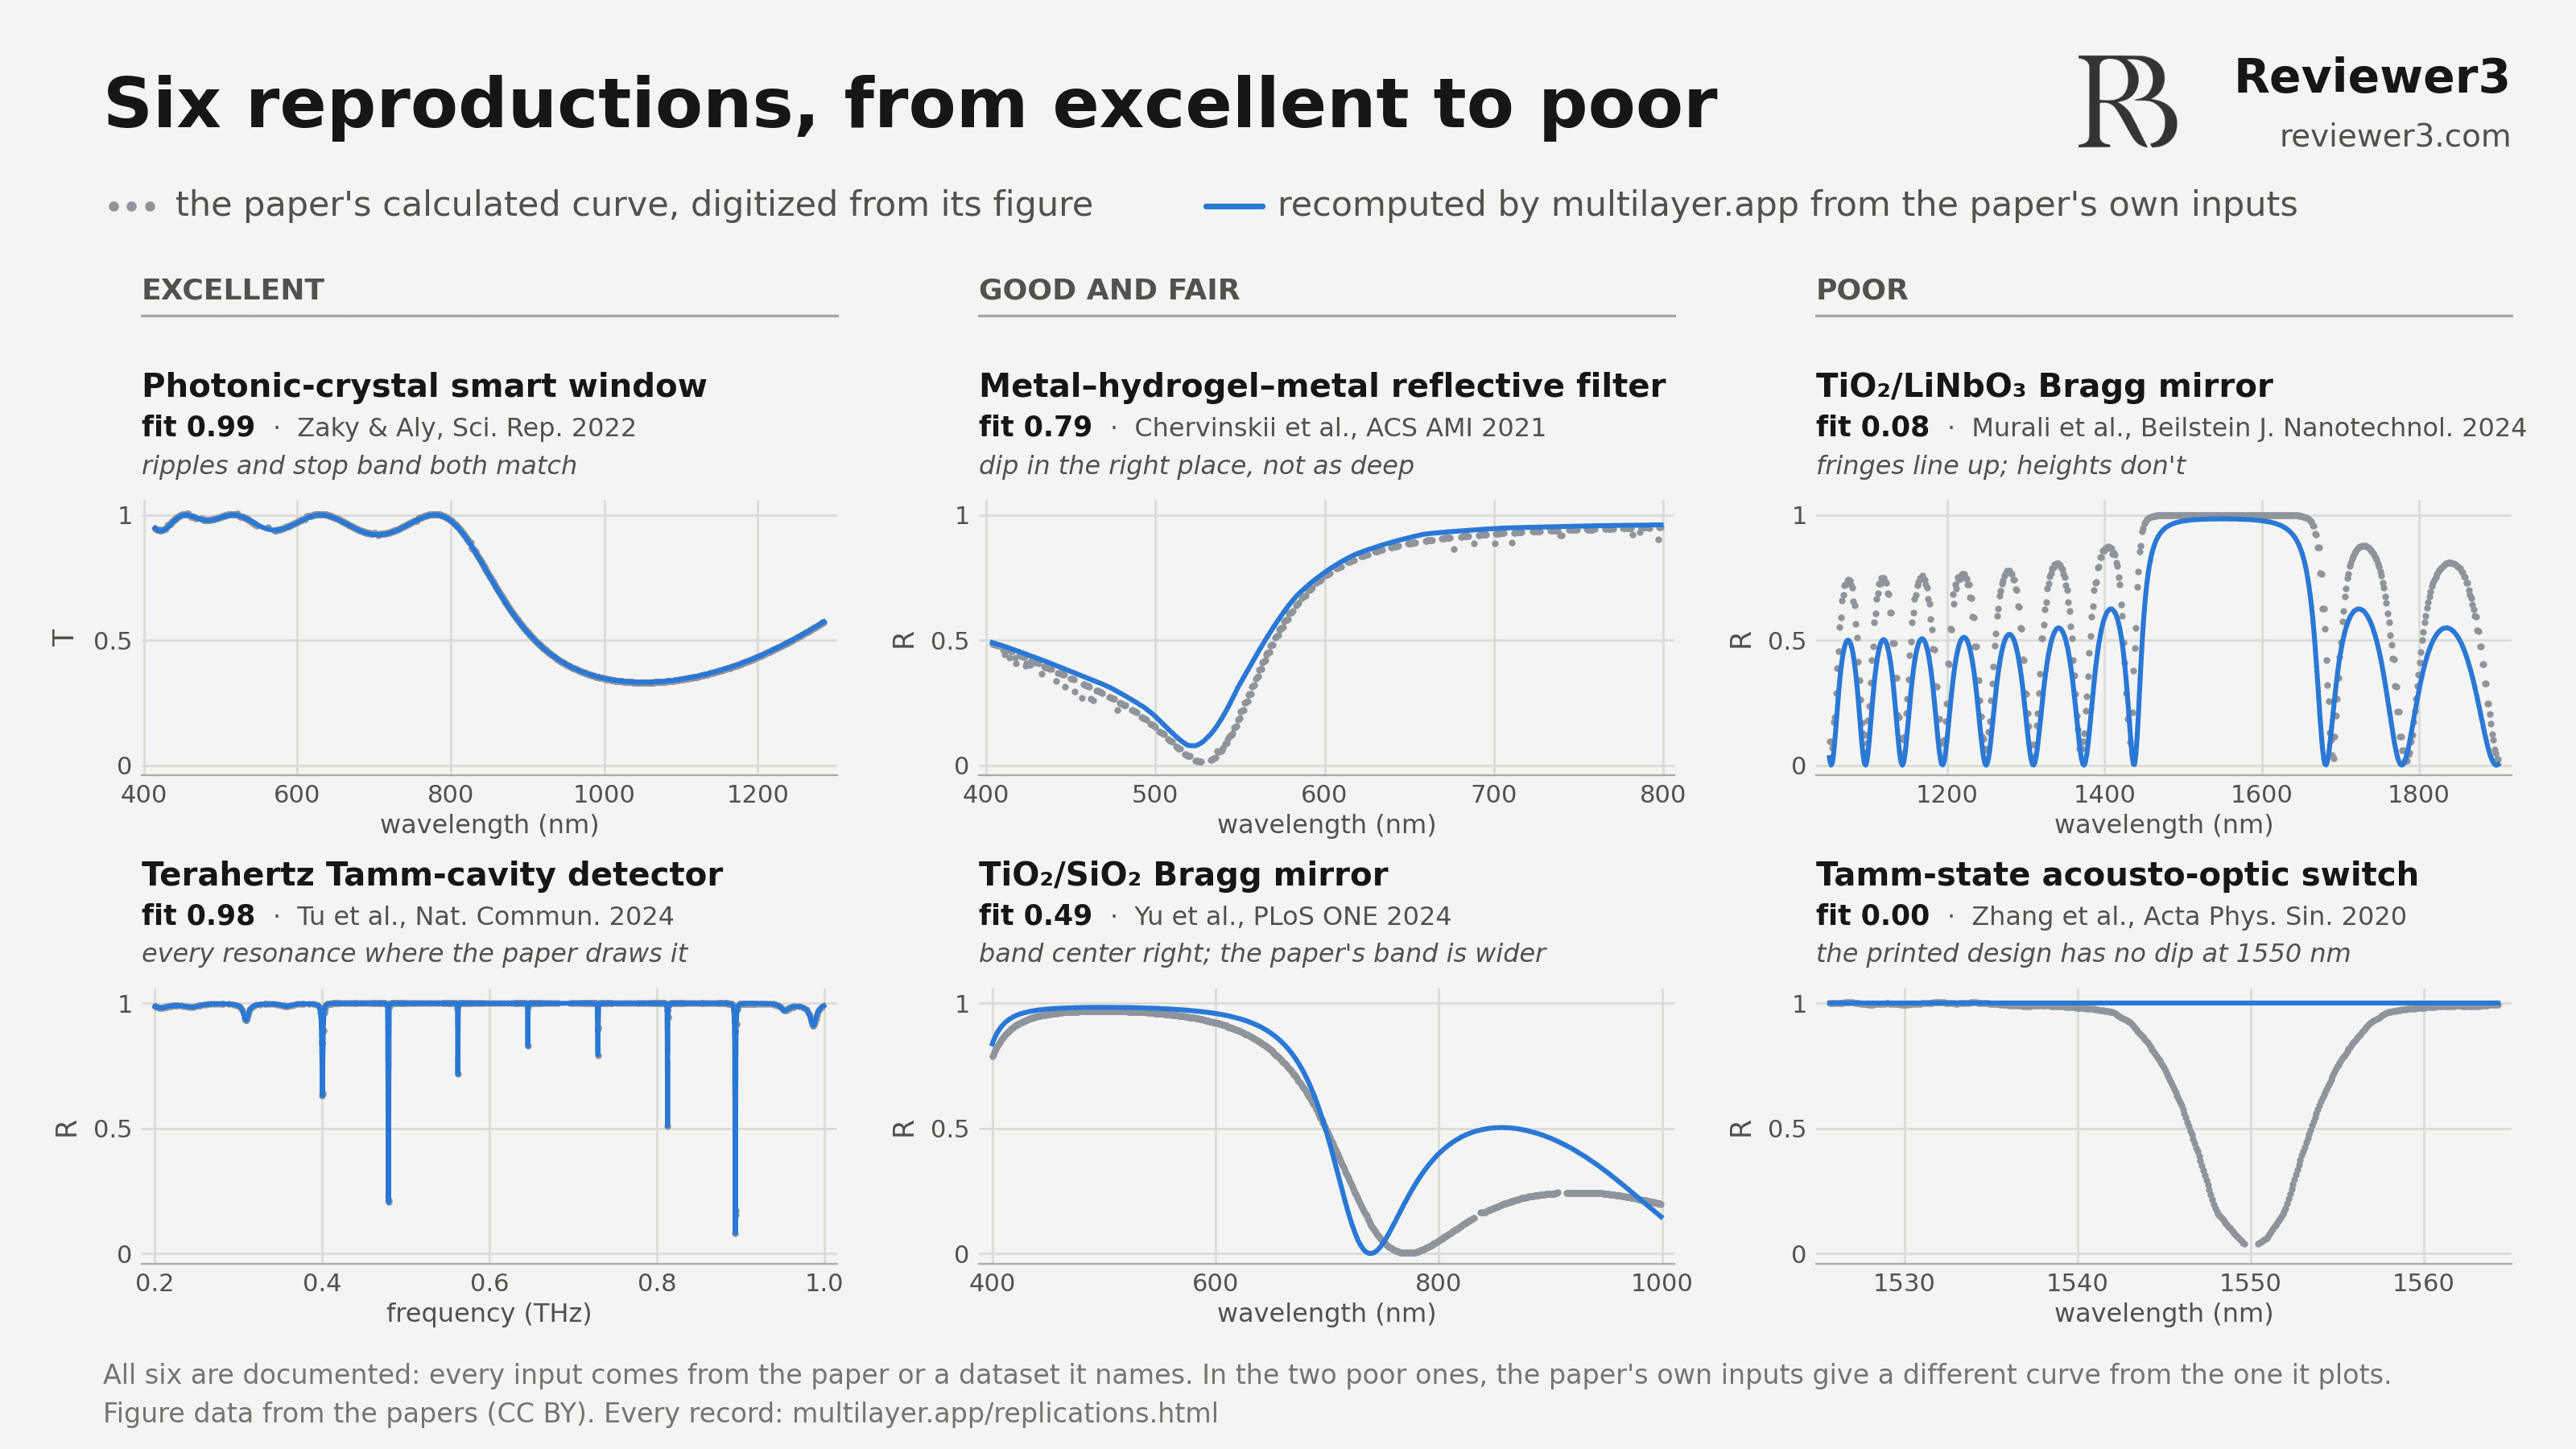
Figure 1. Six of the 181 reproductions, from excellent to poor. Gray: the paper's own calculated curve, digitized from its figure. Blue: the curve recomputed from the paper's own inputs. In all six, every input comes from the paper or a dataset it names.
How it works
- Read. Reviewer3 reads each paper and records every layer in order with its thickness, the claim (which quantity, over which wavelengths, in which figure), and where each material's optical constants come from.
- Recompute. multilayer.app traces the paper's curve from its figure, takes each material's refractive index n and extinction coefficient k from the paper where it gives them, or else from the dataset it cites or from public data, and recomputes the spectrum.
- Score. Each reproduction gets two independent grades. The fit, from 0 to 1, says how closely the recomputed curve follows the paper's: poor below 0.30, fair below 0.60, good below 0.80 and excellent from 0.80 up. The documentation says whose inputs the fit rests on: documented when every input traces to a source the paper names, matched when the paper names a material but not a dataset (so every public dataset covering the wavelengths is tried and the range published), and substituted when a named stand-in replaces a material with no usable data.
What reproduced
| Input documentation | Reproductions | Excellent | Good | Fair | Poor | Band withheld |
|---|---|---|---|---|---|---|
| Documented | 104 | 40 | 15 | 22 | 27 | 0 |
| Matched | 43 | 12 | 4 | 6 | 6 | 15 |
| Substituted | 34 | 5 | 4 | 9 | 10 | 6 |
| All | 181 | 57 | 23 | 37 | 43 | 21 |
Table 1. The 181 reproductions by fit band and input documentation.
Most rest on the paper's own inputs. In 104 of the 181, every input traces to a source the paper names. In the other 77 we chose the optical constants for at least one material, and the fit measures that choice as much as the paper.
For 21, that choice is the verdict. Public datasets for the same materials put these reproductions in different bands, so the page shows the range instead of a band. In five, it runs from poor to excellent. A name like TiO₂ covers films whose index depends on how they were made.
A poor fit can be a finding. In 17 papers, the paper's own inputs produce a different curve from the one it plots, and the record carries a note with page numbers so anyone can check. The two poor examples in Figure 1 are of this kind. In the Bragg mirror, the fringes line up with the paper's, but the paper draws its first sidelobes at 0.88 where its printed indices give 0.62. In the Tamm-state switch, the paper draws a dip to 0.04 at 1550 nm, while its printed design reflects everything across the window. These notes are about whether a figure reproduces, not about the authors: an unstated input can explain a gap as easily as a mistake can.
What makes a paper recomputable
Everything a recomputation needs can be stated in the paper:
- Optical constants for every material: a table, a model with its coefficients and units, or a citation that picks out one dataset. "Ag (Johnson and Christy, 1972)" does; "Ag" doesn't.
- Every layer in order, with its thickness, including the substrate and whether it is treated as thick and incoherent.
- Where the light enters and exits, with the angle and polarization.
- The numbers behind each plotted curve, or the figure as vector graphics, so it can be read without tracing pixels.
Explore the records
All 181 reproductions are at multilayer.app/replications, searchable by device, verdict and DOI. If you're an author of one of these papers and think we've read it wrong, tell us and we'll re-check it.
Reviewer3 checks whether a manuscript's claims follow from its evidence, and Code Replication re-runs the code behind them. This study applies the same test to physics with no code to run. If you publish computational optics and want to discuss checks like these for submissions, email us.
Methods
The solver is the transfer-matrix method, built on Steven Byrnes's tmm package, with public optical data from refractiveindex.info and Palik's Handbook of Optical Constants of Solids. The full method, the scoring rules and every record are on multilayer.app.